Oil prices have been among the interest of most investors this year, not just for investment opportunities, but also as a benchmark to track the economic recovery. Recovery, recovery, recovery, it has been more than a year now through the pandemic, and since things started to cool down at the end of the second quarter of 2020, all eyes were on the economic recovery. Politicians, Central Bankers, and almost everyone tried to anticipate when the virus spread could end and the global economic activity recovers. There has been too much uncertainty in this regard with newly discovered variants making it almost impossible to predict what could happen. The vaccination roll-out was the light at the end of the tunnel, but yet there is more about this.
Where do you think oil prices will head in the future?
Well, investors, traders, almost everyone who follow up on the news can’t forget what happened during April 2020, when the West Texas Intermediate crude dived into the negative territory. Just a quick look back for newcomers, as covid19 disrupted the economic activity around the world, oil demand dropped significantly, but it took some time for oil producers to notice the coming risks and put their market-share conflicts aside. They continued to pump oil, adding supply to the market, and inventories were soaring as the restriction on activity reduced demand. Tankers and storages were full, and buyers had no place to store oil or had very expensive options, which made paying a premium for you to take their oil a cheaper alternative. Thus, oil prices fell to $-37. Yes, you were getting paid to buy oil. Then, after this huge collapse, the last US President, Donald Trump intervened to put an end to the clash between Russia and Saudi Arabia. Later on, OPEC and other top producers, aka OPEC+ decided to cut oil output to match the falling demand. The organization had a strategic plan, they go aggressive on cuts at the beginning and they unwind as the economic activity picks up. Their actions worked extremely well, but they had to improvise, especially as the second wave of the virus kicked in, derailing their initial plan.
After the storytelling, let's move forward by dissecting the matters that would drive oil prices higher or lower in the coming period. Moreover, there will be a review on top bank’s oil price forecasts and a look on the charts.
The Rising United States Oil Production
During the past couple of years, with the help of shale discoveries, the United States was able to steal the podium positions from Russia and Saudi Arabia, and become the top oil producer in the world. Even, under the Trump administration, the United States was a net annual petroleum exporter for 2020, for the first time since 1949. As oil prices recovered significantly during the past 12 months, US shale oil producers are coming back to work, fighting to get a portion of the cake, aiming to recover from last year’s losses, incurred from pausing production due to prices falling below cost. Currently, as per the US Energy Information Administration, the production is stalling near 11 million barrels per day. However, if we take a quick look at seasonals, we can notice that during the past 10 years, the US production activity picked up towards the year-end. The charts below are showing the US production since 2015, and how production progressed on average since 2011, versus this year’s path.

The United States oil production
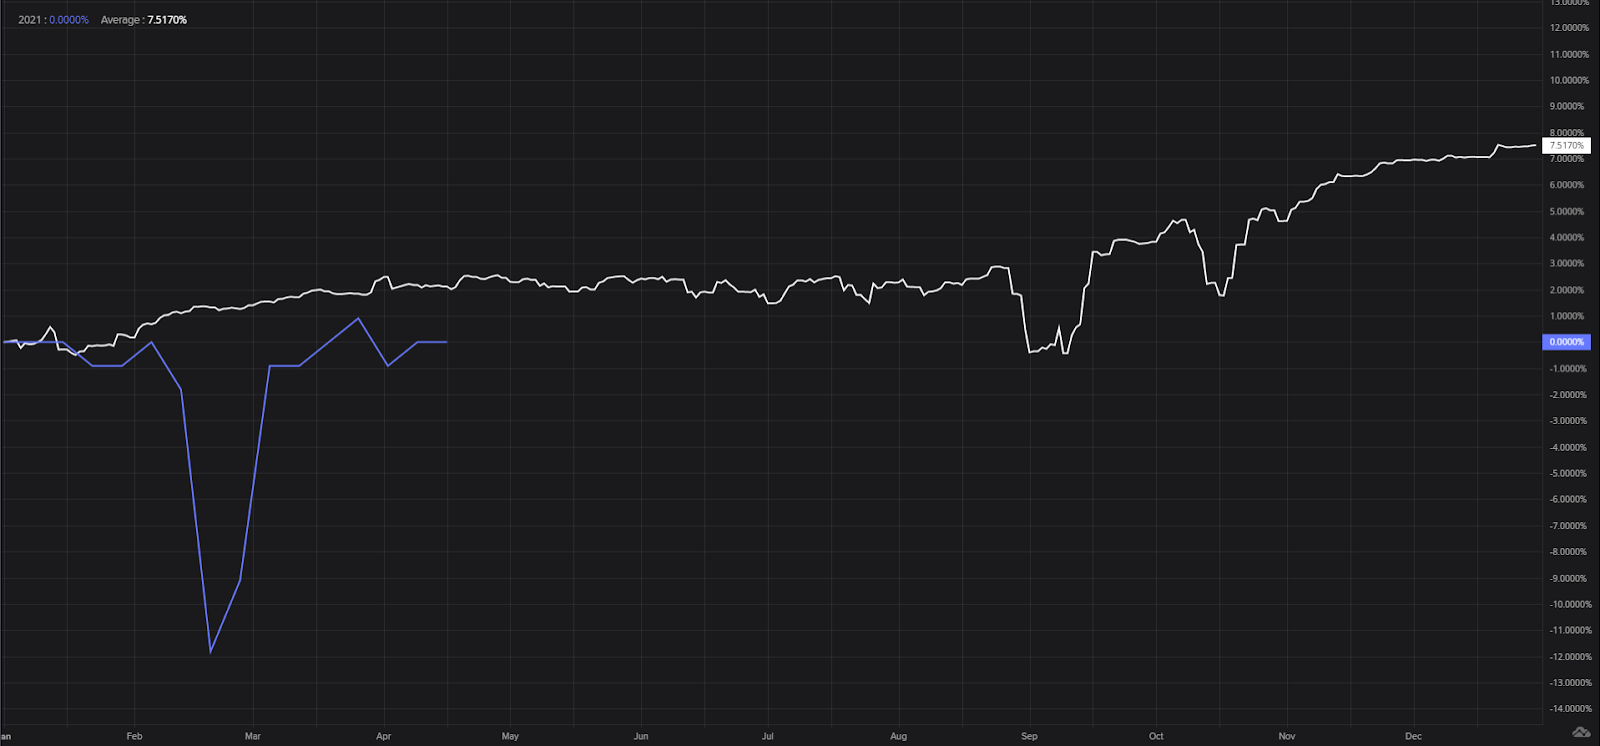
The United States production this year, relative to the past 10 years.
Biden’s Administration and the Nuclear Deal
The nuclear deal between the World's superpowers and Iran has been an interest for energy market participants. In May 2018, the prior US President Donald Trump abandoned the deal that the Obama administration struck with Iran, and implemented sanctions on the regime, targeting oil exports, which offer a massive flow of funds to the system. The move pushed the tensions between the two countries to historic heights. As Biden came to the presidency, he seemed more open to negotiating with Iranians. The recent negotiations that took place were described as very constructive by both ends' officials. The prospects of restoring the same deal are low, but as long as the parties are in talks, they can agree on a different scheme, which would come back to oil markets with additional supply from Iran. The chart below shows how the Iranian oil production was affected in the past 10 years, after striking a deal with Obama, Trump's step in abandoning the deal, and post-covid outbreak/ Biden’s win.
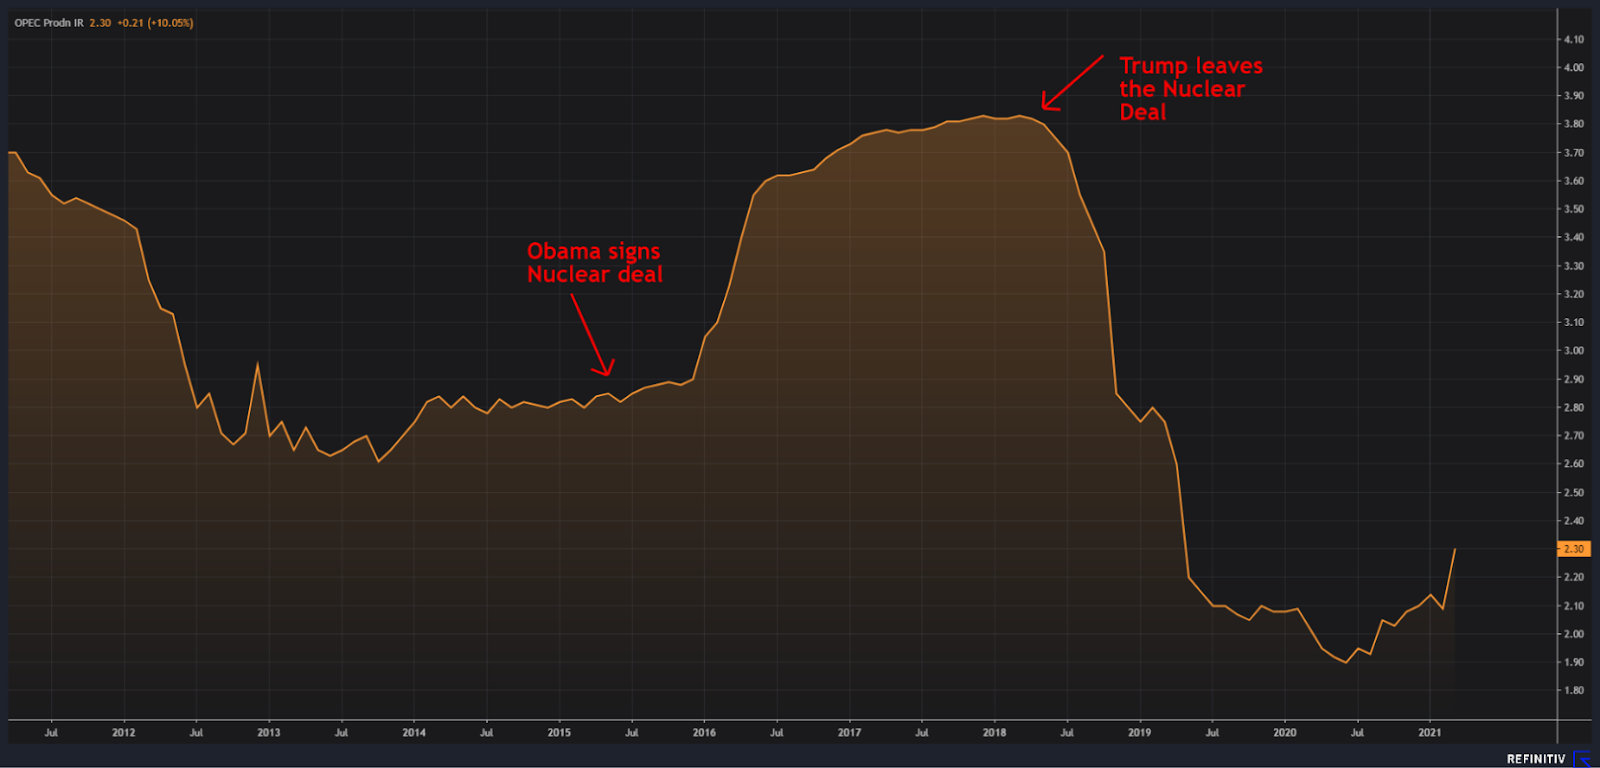
Iran Oil Production
OPEC+ Long-term disputes
Early in 2020, when the covid19 outbreak was immature yet, we started seeing conflicts arising between OPEC+ components, especially Russia and Saudi Arabia, which account for the biggest portion of the production. The fears of the oil price war weighed on prices back then, and with lower demand caused by lockdowns, oil prices suffered sharply, and the West Texas Intermediate benchmarks fell as low as -$37. As oil producers realized that they have to put aside their disputes in the short run at least till the oil market stabilizes, they agreed on a certain quota that has been altered frequently to match market demand. Lately, we have witnessed different views on production, some members wanted to pump more oil for different reasons, and others such as Saudi Arabia preferred to continue supporting the fragile market. The kingdom voluntarily announced cutting production significantly, allowing Russia and Kazakhstan only to adjust their production a little bit to the upside, taking into consideration seasonal factors. In every report, the compliance to these cuts is earning investors' attention. Covid19 forced governments to implement exceptional spending measures, raising their budget deficits. Oil producers are seeking higher earnings from their selling to cover these deficits. This will lead to clashes in the longer term as we can see that the recovery from COVID19 is uneven around the world. This is leading to some producers being more fortunate than others which will make it hard to stick to a certain quota to match everyone. OPEC+ meetings will become more challenging going forward, and a failure in keeping a proper plan to support the market will weigh on prices again.
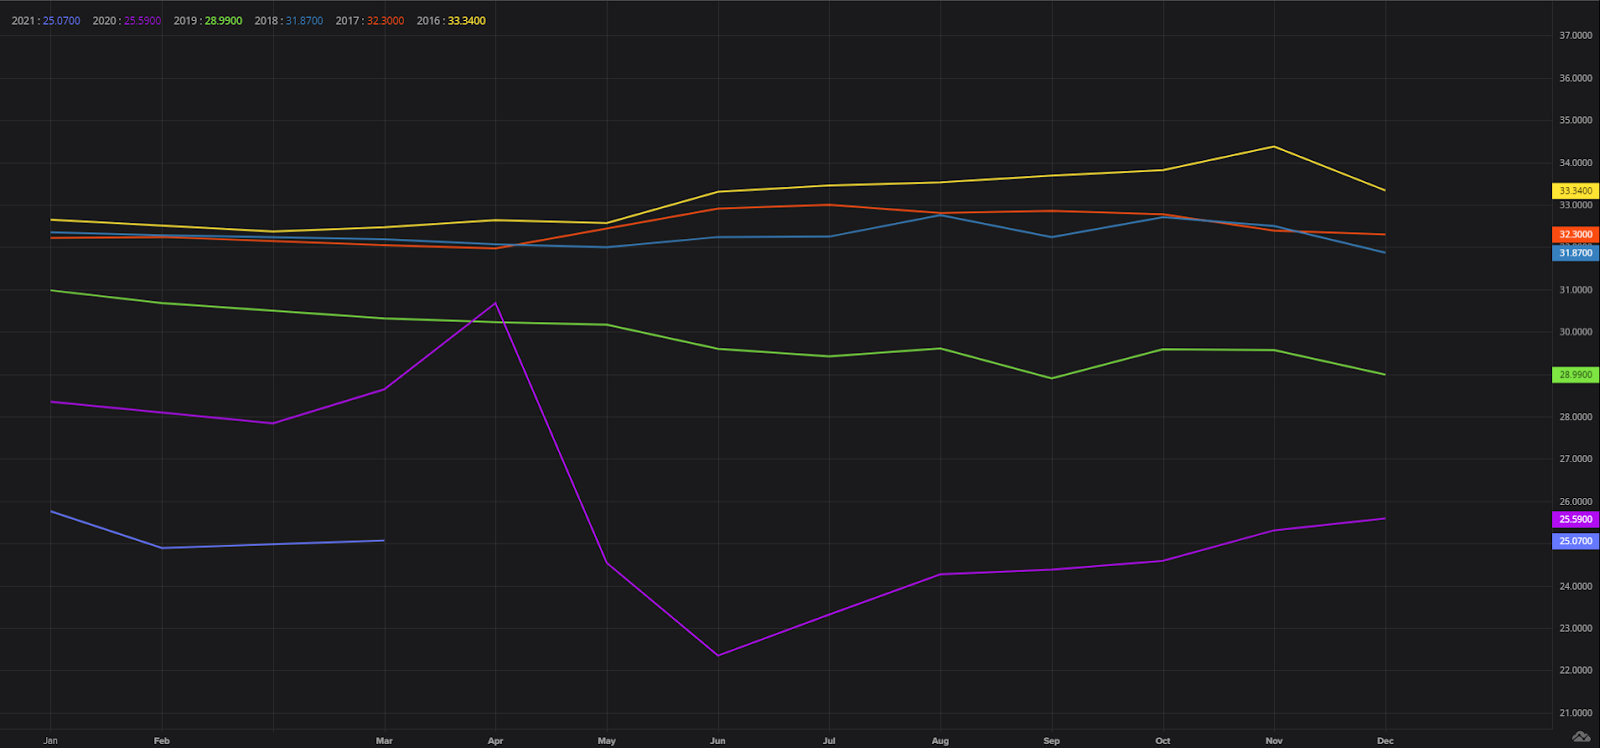
OPEC Production Patterns 2016 till date.

Russia Oil Production Patterns 2016 till date.
Green Energy Era
The covid19 outbreak urged policymakers around the world to take more steps to protect the environment. Among these steps are reducing carbon emissions, and this came more into the spotlight with Biden supporting going green and fighting the traditional energy sources. The latter is proposing a massive infrastructure plan that promotes clean energy sources. A clear example of where the world is going in terms of energy can be seen with the latest rush to electric cars. The World's top carmakers were challenged by Tesla and its likes to design an alternative that is better for the environment. Many carmakers are shifting to electric cars, this will be followed by electric boats, and electric planes, which in the long run would impact negatively oil demand levels. Moreover, the technology behind green energy sources is progressing by the day. These alternatives are becoming cheaper and more efficient than traditional ways. China and the United States which account for almost 35% of the world's emissions are moving forward with cutting plans, among them increasing non-fossil share of primary energy, promoting financing for green energy sources, and much more.
The charts below show how the issuance of Green bonds was emerging in the past years, and growing investors' interest in Renewable and Alternative energy.
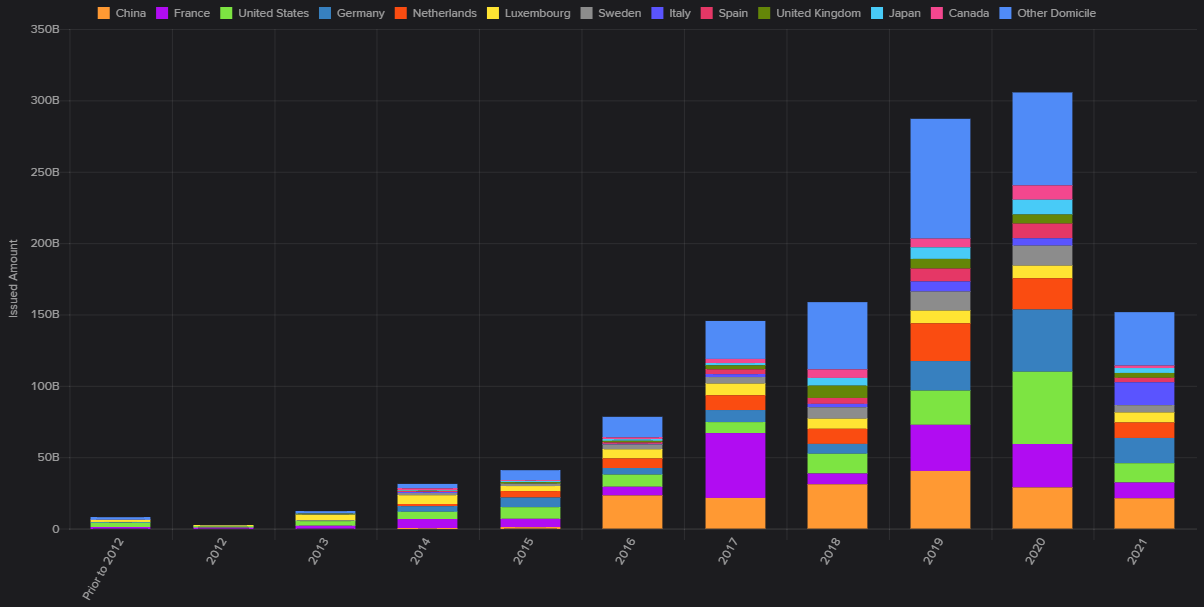
Green Bonds Issued in US dollars.

FTSE Environmental Opportunities Renewable and Alternative Energy 50 Index
COVID19 Continuous Spread
Covid19 disrupted the global economic activity significantly during the second quarter of 2020, and since then investors were trying to anticipate when the world would be virus-free, and the economic activity would go back to pre-pandemic levels. This is a million-dollar question, when the virus first invaded the world, market participants were expecting the recovery to take place in six months or a bit more, but until now, the world hasn't recovered and the virus is hitting back with different variants. When the vaccines were founded and approved, we were so optimistic about them, but as we are witnessing by the day, some of them are being avoided, and on the other hand, the vaccine rollout around the world is very slow and is limited to rich countries. Top oil producers are raising their forecasts for oil demand, but they aren't close to what they expected at the beginning of the pandemic. On the other hand, the virus created new habits for people and organizations. Many corporations are satisfied with the performance of remote working, and some are giving their employees the choice of doing it forever. These habits will also delay any restoration of economic activity or at least oil demand to pre-pandemic levels.

Covid19 Daily Cases
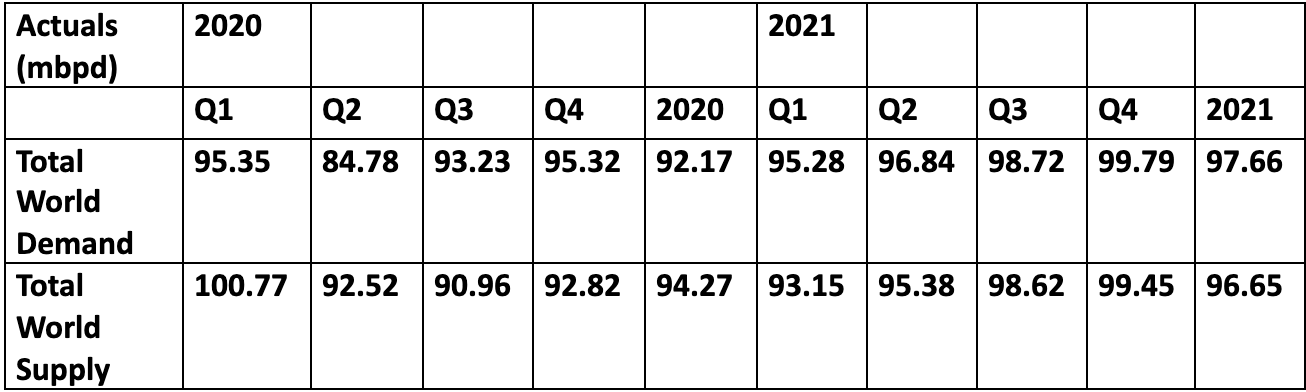
United States Energy Information Administration oil supply/demand forecast
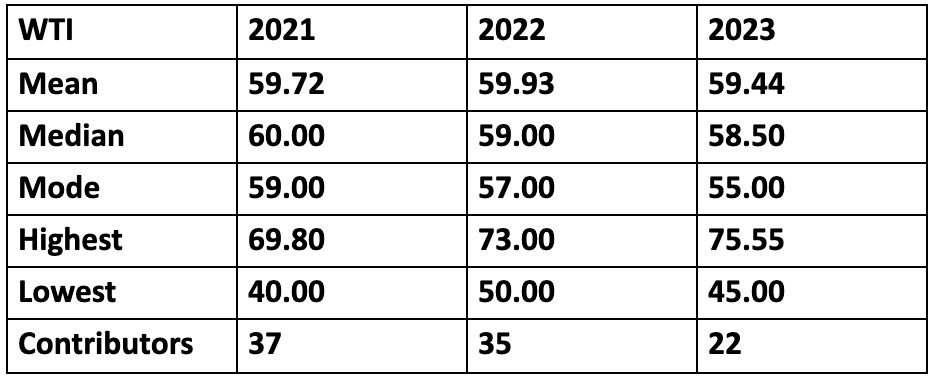
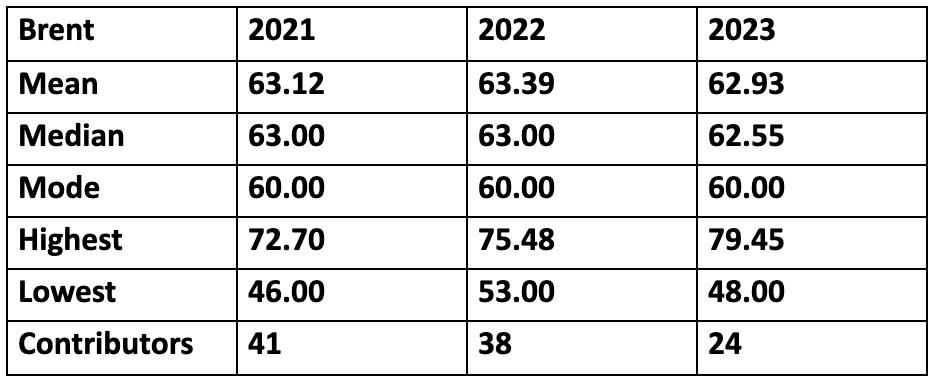
Top Banks View on WTI and Brent
After going over the key matters that would impact the oil markets in the months to come, let's have a look at what top banks are forecasting for oil prices.
The majority of banks don't see significant changes in prices for the coming years to come. The mean, median, and mode for 2021 are almost 5% lower than the current price. However, with so much uncertainty around the future, these numbers could be adjusted more frequently to adapt to the ongoing drivers.
What does the charts say?
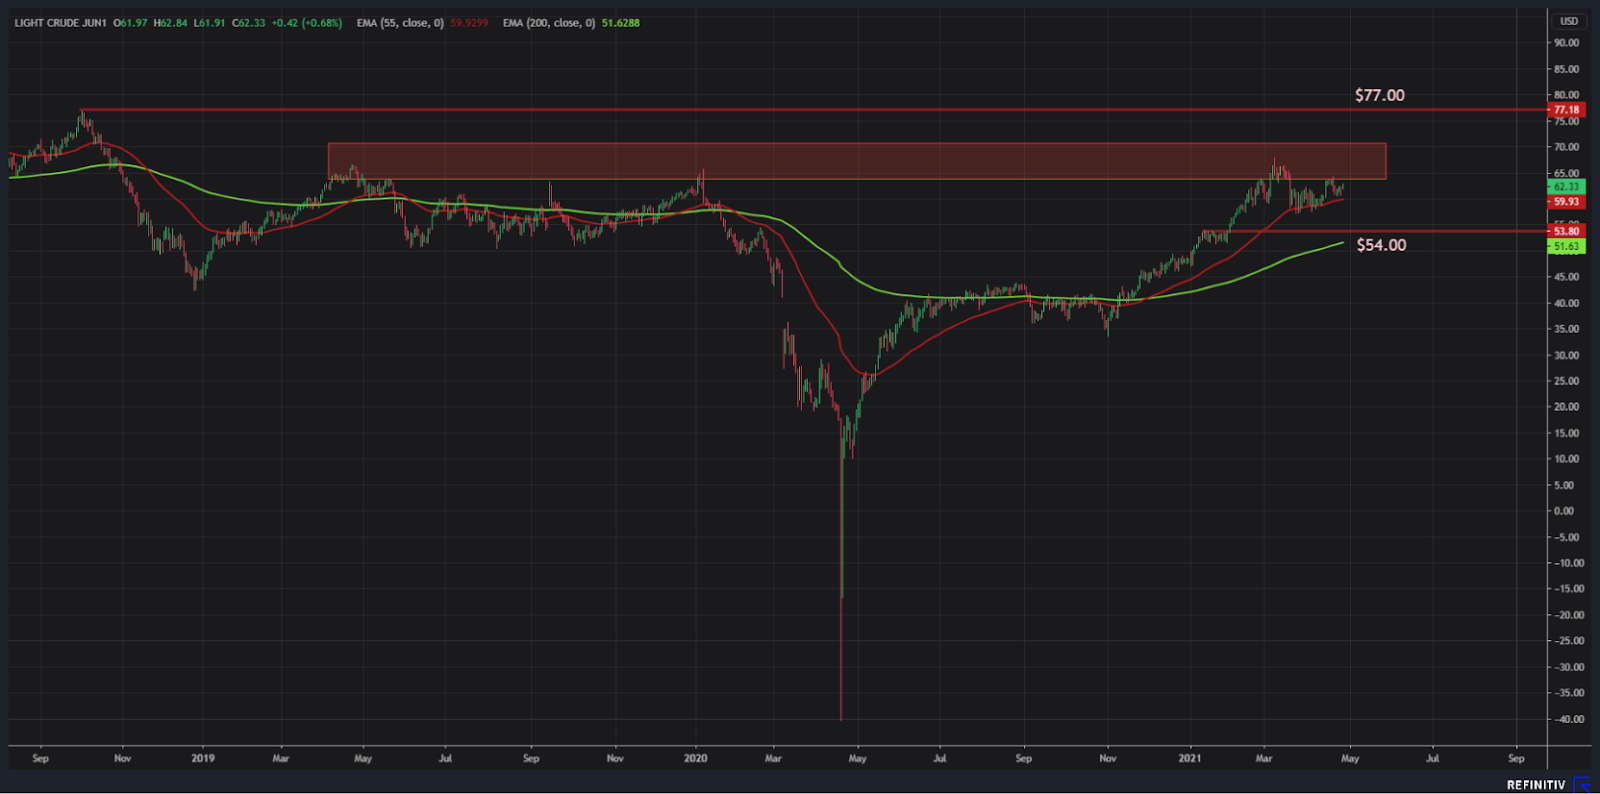
West Texas Intermediate. Daily Time Frame. EMA 55 – 200.
The WTI price had a tremendous rally since its bottom in April 2020. Recently, the price has hit a resistance area, near the highest prices reached since March 2019. A correction took place towards the 55-day Exponential moving average which is currently holding.
The bearish scenario comes with the price breaking below the 55-day EMA targeting the 200-day EMA, which would coincide with a previous resistance area tackled ahead of the last push higher, possibly turning into support.
The bullish scenario is a break above the interim top of $64.40, pushing higher to a retest of 2021 high of $67.90, where a break above the red box would target $77.00, the highest since October 2018.
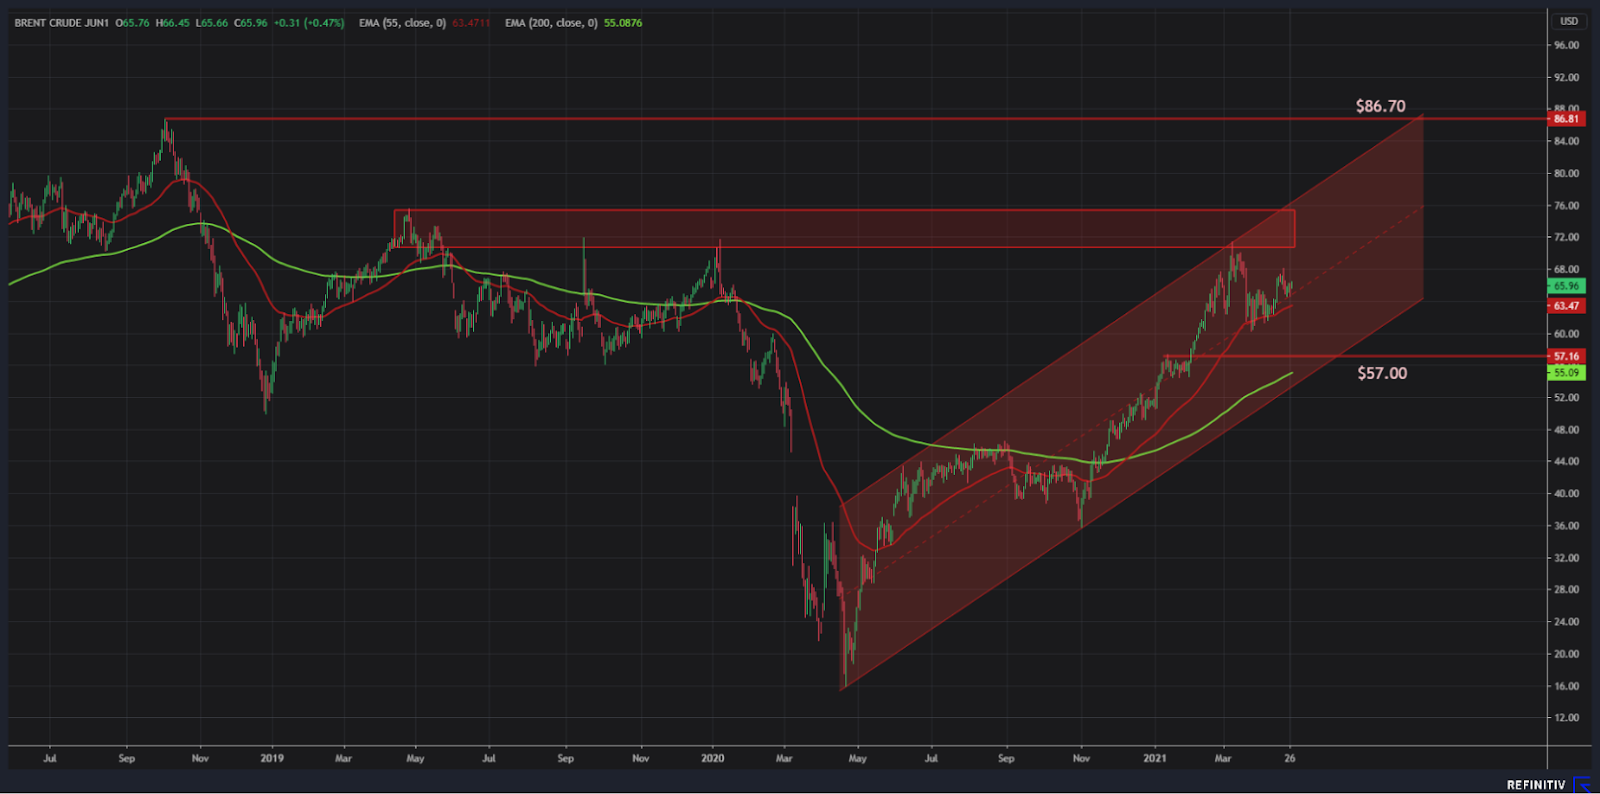
Brent Crude. Daily Time Frame. EMA 55 – 200.
Since its bottom in April 2020, the price of Brent crude has been trending upward in an equidistant channel. After logging, its exact 2020 high of $71.36, the price traded sideways, recording lower highs and higher lows, supported by the 55-day EMA.
The Bearish scenario would be with the price breaking below the 55-day EMA targeting the 200-day EMA, which could coincide with the bottom of the channel and a previous resistance area that could turn into support, near $57.00.
The Bullish scenario would be a break above the interim high of $68.04, aiming at a retest of 2021 high of $71.60. An extension to the upward move with strong momentum could lead to trade at $86.70, the highest since October 2018.
Author: Wael Makarem, Market Analyst at ICM.com

Wael Makarem is a market analyst with ten years of experience. He joined the world of trading since he was still earning his Business Administration and Finance degree at the American University of Beirut. He enrolled several openings with reputable forex brokers. Also, he is serving as a committee member at the Lebanese Society of Technical Analysts (Chapter of the International Federation of Technical Analysts). He held a series of educational seminars and webinars tackling numerous trading topics aiming at sharing his knowledge with traders.